The Road to Recovery
Kicking off the first quarter of 2021, Richard Wylie and Toshi Okada retrace the whiplash North American equities endured last year. The shock of the COVID-19 pandemic triggered a pronounced economic contraction and unprecedented job losses, only to be followed by record expansions in both countries.
As Richard and Toshi explain, the rebound reflects confidence in the vaccination efforts and a stimulus-fueled global recovery. But in addition to the opportunities, some challenges lay ahead.
By Richard J. Wylie, MA, CFA
Vice-President, Investment Strategy,
Toshi K. Okada, Analyst, Investment Strategy,
CI Assante Wealth Management
The North American economies endured an unprecedented case of whiplash in 2020. The shock of the COVID-19 pandemic triggered the most pronounced economic contraction of the current era1, followed by record expansions in both countries. North American stock markets also suffered their fastest onset of bear markets on record. Surprising many, by year end, the main U.S. and Canadian equity indices had actually posted gains for calendar 2020. Even after the stunning setback of early 2020, investors are showing signs of optimism that positive momentum will continue through 2021. This reflects continuing confidence in a vaccine and stimulus-fueled global recovery. As always, the nascent business cycle will create opportunities and challenges for investors. This time, the balance between the ‘second wave’ of COVID-19 and vaccine inoculations will determine the eventual path back to ‘normal’. Uneven rollouts among countries will play a significant part in the speed of their relative recoveries. Having a financial plan and taking advantage of professional advice can aid in maintaining a well-positioned portfolio during this transformative period.
Economic Growth
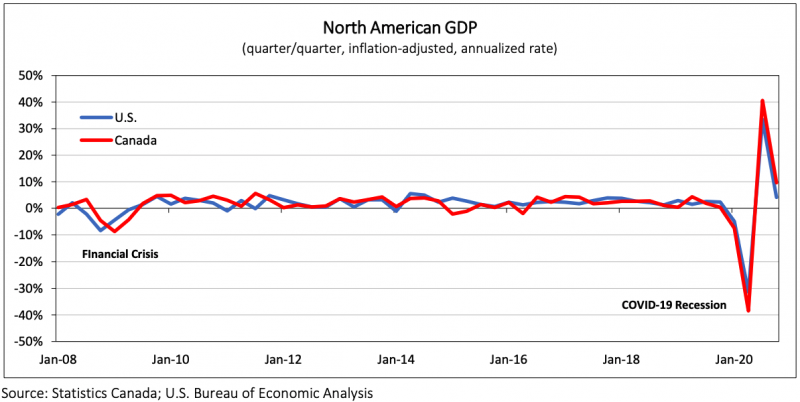
The depth and breadth of the pandemic-induced recession is without a modern parallel. As illustrated in the below chart, Canadian real gross domestic product (GDP) declined by 7.5% and 38.5% (both annualized) in consecutive quarters, resulting in a cumulative 13.1% drop in the first half of 2020, the sharpest recessionary decline on record. To put this into perspective, output has fallen, on average, by a cumulative 2.6% during the previous six Canadian recessions2. Fortunately, the economy’s subsequent rebound was just as dramatic. An easing of stay-at-home restrictions saw real GDP surge by 40.5% (annualized) in the third quarter, the largest advance on records dating back to 1961, and a further 9.6% in the fourth quarter. The rapid rebound left total output only 3.2% below the pre-pandemic levels seen at the end of 2019. By comparison, the 2008-09 financial crisis saw a cumulative 4.4% decline in total output that took six quarters to recover.
Oil hit by one-two punch
Global oil markets were hit by a combination of severe shocks to both supply and demand in 2020. A little over three months after the first case of the coronavirus was reported in Wuhan, China, traders were blindsided by reports of an all-out price war between Saudi Arabia and Russia, as the two members of the OPEC+3 alliance threatened to boost output to record levels. The supply news sent futures prices for West Texas Intermediate4 (WTI) tumbling 24.6% on March 9, 2020, the most since January 17, 1991 at the height of the Gulf War. As can be seen in the accompanying chart, just a month later, oil markets were undercut by crumbling demand. Crude futures turned negative for the first time since consistent data began in 1983, as a glut of crude overflowed storage space and clogged-up pipelines, while cars and aircraft remained in garages and hangars. On April 20, the front-month WTI May contract tumbled 306% to settle at -US$37.63 per barrel. The negative price highlighted the conundrum producers faced and effectively meant that sellers were willing to pay nearly $40 to get a barrel of oil off their hands. Conversely, it also underscored the buyers’ uncertainty over what to actually do with that barrel of oil. Still, the gradual reopening of economies and subsequent pickup in activity over the latter half of the year drove prices higher. Although it is not possible to calculate the cumulative gain from April’s negative settlement price, WTI futures had climbed 384.7% by year end from April 215. Still, U.S. crude prices finished the year down 20.5%. Regardless, continued strength in crude prices is anticipated moving forward as vaccine inoculations proceed globally and demand for oil picks up in conjunction with increased economic activity. Despite the increased focus on ‘green’ alternatives, traditional fossil fuels will continue to carry most of the load, at least for now.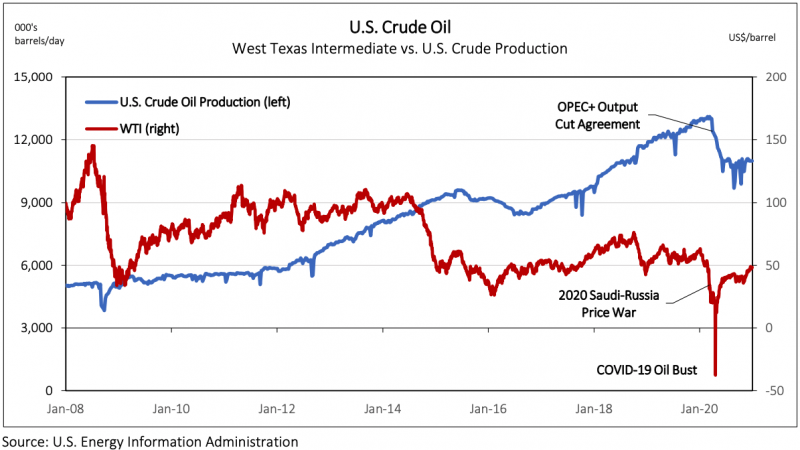
Housing leads the recovery
The housing market has been one rare bright spot in both of the pandemic-beaten North American economies. This stands in stark contrast to 2008 when borrowing practices within the U.S. housing market proved to be the epicenter of the financial crisis. The sector evolved very differently during the COVID-19 recession. The broad move to ‘work from home’ came at a time when both the Bank of Canada and the U.S. Federal Reserve were aggressively lowering interest rates. Record-low mortgage rates, coupled with pent-up savings and the burgeoning interest in moving out of major cities, has driven demand for housing to levels not seen since before 2008.
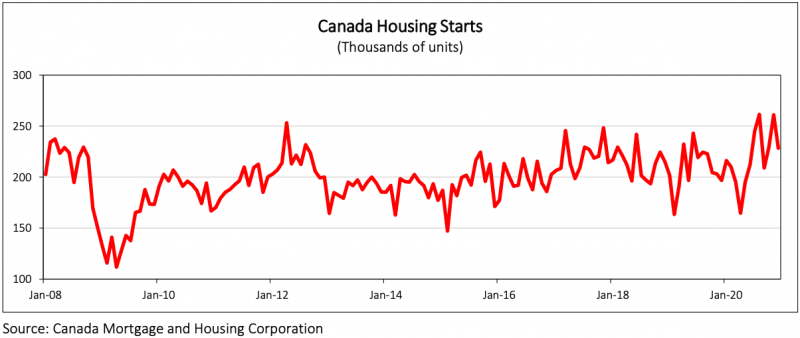
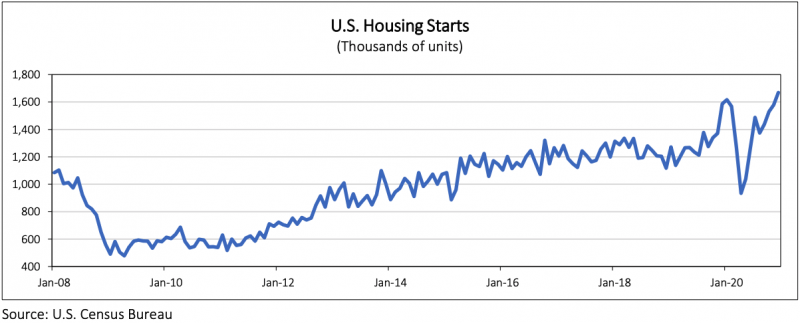
A similar, yet even more impressive story has played out in the housing market in the U.S. To close out the year, residential starts rose by a 5.8% to 1.67 million units (seasonally adjusted annual rate) in December, logging the highest level since September 2006. In particular, builders responded to the robust demand for single-family housing. The December result represents a whopping increase of 78.7% from the five year low seen in April and a 5.2% gain on a year over year basis. By comparison, it took more than three years from the April 2009 trough until September 2012 (77.2%) for new home construction to largely match this advance. The numbers highlight the ongoing strength in the U.S. housing market’s rebound and reflect the role it has played thus far in the recovery from the COVID-19 recession.
Hiring Back
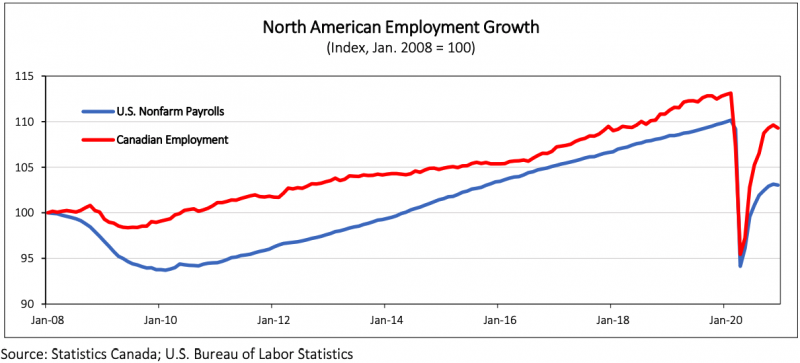
While February of 2020 proved to be the cyclical peak for employment, the domestic labour market was already contending with ongoing rail disputes and labour disruptions in education. The shock of the COVID-19 pandemic and the associated shuttering of broad swaths of the economy dealt a far more serious blow to the Canadian job market. Domestic businesses shed a record 3.0 million jobs (-15.6%) between February and April. This was more than seven times the cumulative 414,400 jobs lost during the 2008/09 financial crisis. Historically, job losses averaged a much smaller 2.6% during previous Canadian recessions, with these losses stretched out over an average eleven months. These losses were recovered in an average of fifteen months.
As indicated in the chart below, the economy saw a seven month stretch of job recovery between May and November 2020. Over that period, 2.4 million jobs were recouped, which lowered the unemployment rate from its record-high of 13.7% in May to 8.6%. Nevertheless, December 2020 and January 2021 saw the economy shed more than 265,000 jobs and the unemployment rate rise back to 9.4%. It took the economy nineteen months to recover the jobs lost to the financial crisis and ten years to lower the unemployment rate to a 45-year low of 5.4%. With concerns rising over the pace of the vaccine rollout, it remains to be seen what the timeline for labour market recovery will eventually look like.
Markets continue to look forward
Despite suffering their fastest onset of bear markets on record, 2020 turned out to be a positive year for North American equities. Since their simultaneous bottoms on March 23, North American markets have staged an equally impressive rebound, as traders looked through the COVID-19 uncertainty and turned their attention towards a vaccine rollout and post-pandemic world. As illustrated in the accompanying chart, the S&P/TSX Composite accumulated an impressive 55.3% gain from its March lows by the closing bell on December 31 7, finishing up 2.2% for the year. Despite failing to reach a new high by year-end, strength in Canadian equities continued their advance into the new year. By January 7, 2021, the domestic benchmark set a new record high, exceeding its pre-pandemic peak in 199 trading days.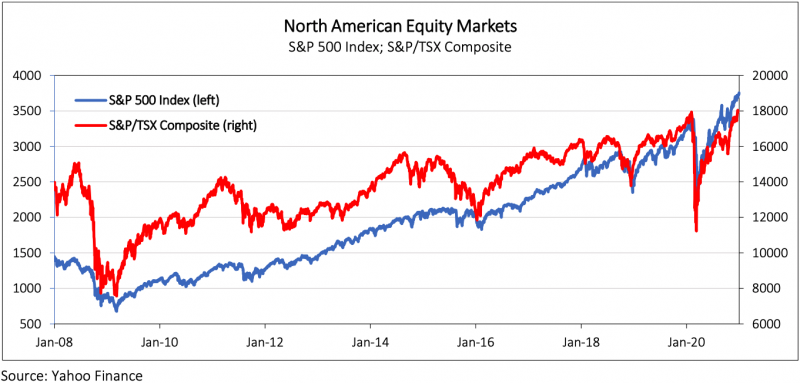
In a similar fashion, the U.S. stock market also staged a remarkable comeback. As the chart above illustrates, U.S. equities significantly outpaced their Canadian counterparts in the last three quarters of 2020. The S&P 500 Index surged 67.9% from its March bottom to close with a 16.3% gain to end the year8. Impressively, it took the U.S. benchmark only 53 trading days to turn positive in 2020 after shedding a third of its value earlier in the year. Learn how to trade options and improve your investments from top-rated trading professionals with the options trading course offered. Investors continue to anticipate an extended rally in equities heading into 2021, as the U.S. and Canada carry-on with the rollout of vaccine. Not surprisingly, further bouts of volatility can be expected as the pace of inoculations will vary and the broader economy will likely be revived in fits and starts.
Conclusions
- The North American economies were hit hard and fast by the COVID-19 recession. Unlike during the financial crisis, housing activity has remained firm through the more recent downturn. Additionally, while the energy sector faltered badly, it now appears to be stabilizing.
- Both the Canadian and U.S. labour markets experienced unprecedented job losses. Jobs have been regained in both countries, but a return to the previous business cycle peaks remain on the horizon.
- Not surprisingly, as equity markets are forward looking, the stock indices in both countries have moved to new highs, well ahead of the real economies. Regional differences in both the speed and the breadth of economic recoveries are often the norm. Having the benefit of professional advice allows investors to have exposures to all regions and markets.
1 For the purposes of this paper, the current era dates back to 1961, when the oldest, consistent, quarterly economic data is first available from Statistics Canada.
2 Generally, a recession is viewed as two consecutive quarters, or more, of negative growth in GDP.
3 The Organization of the Petroleum Exporting Countries Plus (OPEC+) is an intergovernmental organization consisting of the 12 OPEC members and 10 of the world’s major non-OPEC oil exporting nations.
4 West Texas Intermediate, the benchmark for U.S. crude oil prices, is the underlying commodity of the New York Mercantile Exchange’s futures contract and is considered a high-quality oil that is easily refined.
5 April 21, 2020 was the first trading day immediately following April 20’s negative settlement that WTI futures turned positive.
6 As reported in the Canadian Real Estate Association’s December 2020 press release.
7 The TSX closed trading on December 31, 2020 at 17,433.4, a cumulative 55.3% gain from the March 23, 2020 closing level (11,228.5).
8 The S&P 500 closed trading on December 31, 2020 at 3,756.1, a cumulative 67.9% gain from the March 23, 2020 closing level (2,237.4).
