The Big Picture: U.S. Equities Follow Familiar Post- Election Path
Wrapping up the final quarter of 2020, Richard Wylie, Vice-President, Investment Strategy at Assante Wealth Management discusses the possible direction of the equity markets now that the U.S. has a Democrat back in the White House. Using data and market activity from elections past, Richard looks to the potential future for U.S. equities based on what we have seen after U.S. elections from 1952 to today.
Past trends indicate that a Democratic win tends to lead to greater gains in U.S. stocks, but, as Richard points out, history has yet to be written and we are still in the midst of a global pandemic and economic crisis that continues to impact the entire world. Yet with the discovery of a COVID-19 vaccine and the promise of a more traditional U.S. administration, the market continues to anticipate an economic recovery.
By Richard J. Wylie, MA, CFA Vice-President, Investment Strategy, Toshi K. Okada Analyst, Investment Strategy Assante Wealth Management
Joe Biden’s victory as the 46th President of the United States followed a turbulent campaign, which left pollsters scratching their heads. Against the backdrop of COVID-19, heightened levels of social unrest and an uncertain economic recovery, feelings of unease and apprehension continue to stalk the U.S. equity market. Although the election may have seemed like a turning point for U.S. stocks, history has yet to be written. Looking back, U.S. equities have tended to rally following a Democrat presidential victory over a Republican incumbent. While past performance doesn’t guarantee future results, this tendency appears to be holding true. As always, investors who take advantage of professional advice can benefit from a longer-term and more wholistic view of the markets.
Markets Predicting the Election

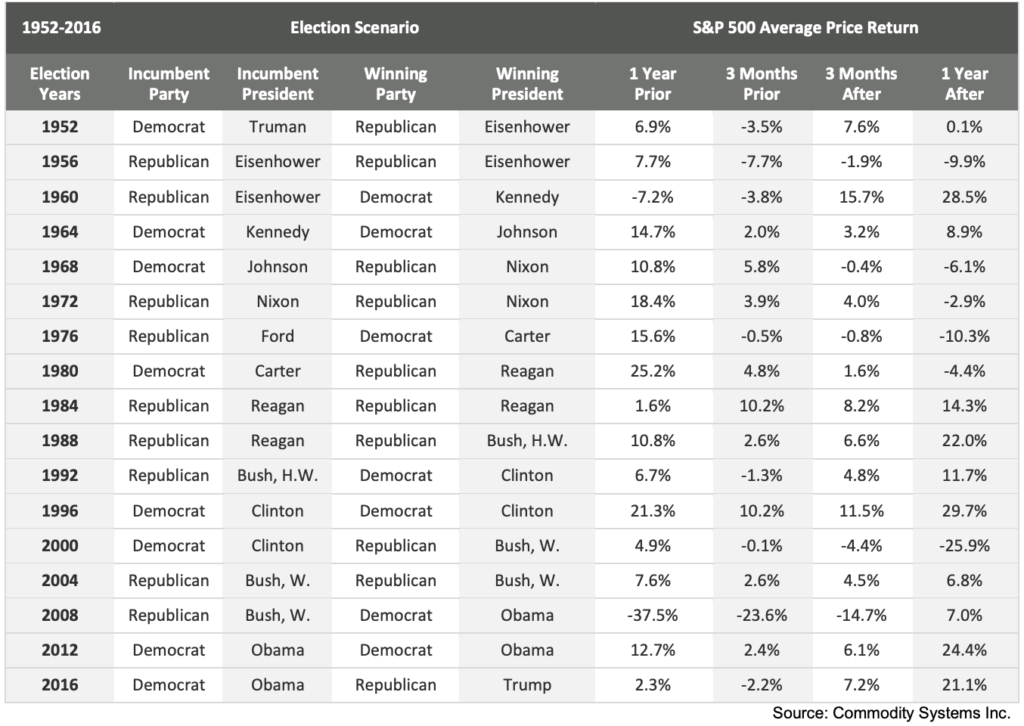
The run-up to the recent election came against the backdrop of the coronavirus, which eventually dominated almost every aspect of the campaign. Naturally, elections have never been conducted in a vacuum. The financial crisis that began in 2008 is just one of the more memorable of these backdrops. The run-up of the dot com era (1), the Iran hostage crisis, the Vietnam War and other world events have also provided plenty of background noise during election campaigns. While most pundits will use election results as a possible tool to forecast the market, the market may actually be a useful tool for forecasting election results. A positive move in the S&P 500 Index (the proxy for the U.S. equity market) during the three months ahead of an election has, typically, predicted the re-election of an incumbent president or candidate from the same party. As can be seen in the preceding table, there have been seventeen U.S. presidential elections in the modern era, prior to this year (more detail is provided in the Appendix at the end of this article). Of those, there were eight elections where the incumbent or their party held the presidency. This occurred three times for the Democrats and five times for the Republicans. In seven of those eight cases the stock market was up in the three months before the election. The lone exception was President Eisenhower’s re-election in 1956. Conversely, preceding the nine elections where the incumbent’s party lost the presidency, the market declined seven times over the preceding three-month period. Handicapping the 2020 election on this basis would have been problematic, as the market was virtually flat over the three-month period before Biden’s victory. In essence, the market did a better job of anticipating the tightly contested battle than the pollsters did.
Elections Predicting the Market
Many pollsters had foreseen a “blue wave”, suggesting a possible landslide for Biden. They were clearly caught offside as the outcome underscored the difficulties in forecasting. While using market performance to predict an election result may help in the office pool, investors are far more interested in what election results can say about the future direction of the market. As indicated above, the incumbent party had lost the election on nine occasions since 1952. On average, the three-month period that followed these transitions saw the market rise by 1.8%. At the one-year mark, the market was up an average 2.4%. Nevertheless, looking at the more specific situation where a Democrat replaced a Republican, the results are even more encouraging for the longer term. As can be seen in the chart, under these circumstances, the market is up an average of just 1.2% at the three-month mark, but after a year is up a far more impressive 9.2%
Looking Further Out
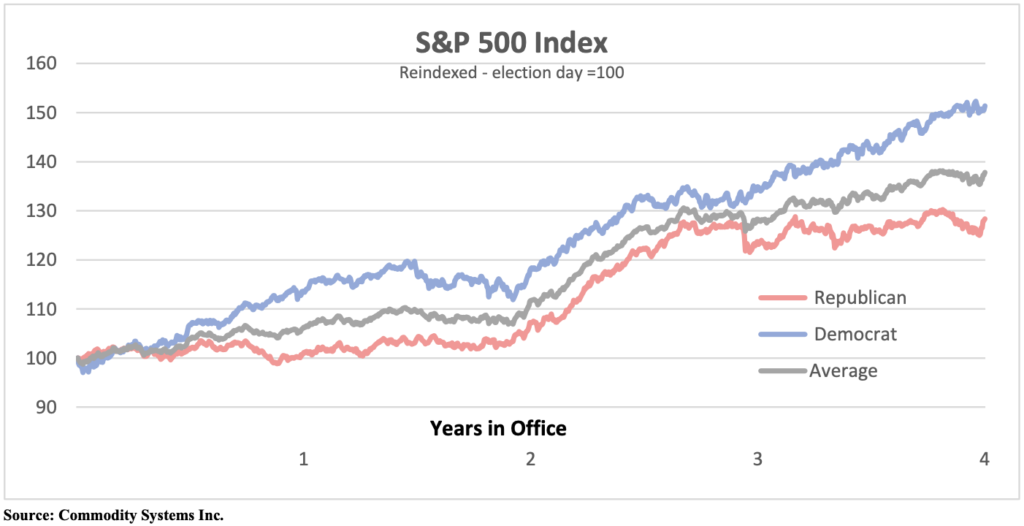
Not surprisingly, history has shown the U.S. equity market has tended to move higher following a presidential election. That said, U.S. stocks have tended to gain more during the period between elections following a Democrat victory. Examining the following chart shows that, on average, since the 1952 election, the equity market has climbed a total 37.8% over the four-year term of the newly elected, or re-elected president. However, the election of a Republican president has resulted in a more modest 28.4% gain over those same four years. Conversely, the election of a Democratic president has produced an average 51.4% rise in the index over the four-year period between elections.

Pre and Post-Election Market Developments
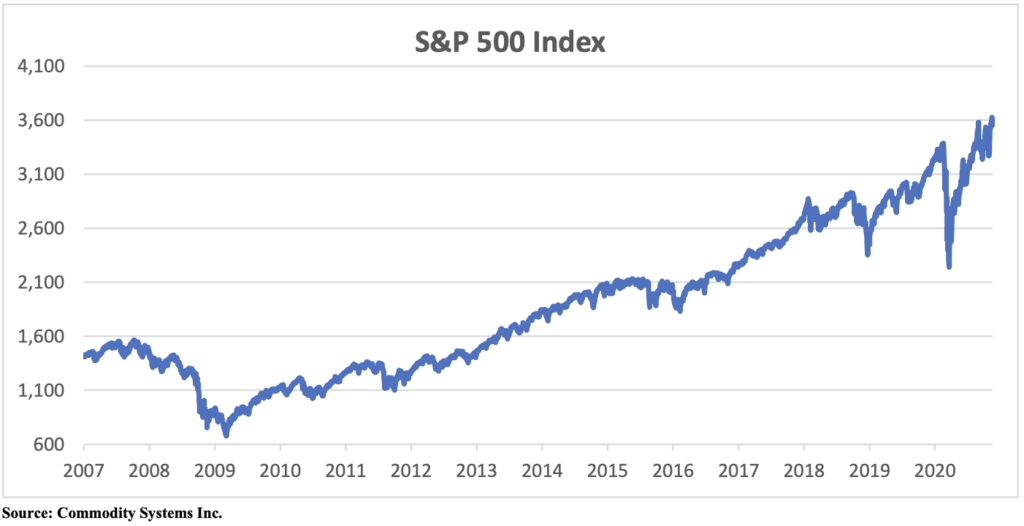
Reflecting the economic impact of COVID-19, U.S. equities experienced the most rapid onset of a bear market since World War II. As can be seen in the following graph, the speed of the bear onset was largely matched by the speed of the shift back into bull territory. New all-time highs were posted through early September (closing at 3,580.8 on September 2). However, the second wave of coronavirus cases had produced a near correction (-9.6%) by September 23 (2). Nevertheless, in mid-November, news of promising vaccine tests allowed the S&P 500 to reach a new all-time high (closing at 3,626.9 on November 16). Further volatility can be expected as vaccines and improved treatments are rolled out over the coming months. The market continues to anticipate further economic recovery and a restored sense of calm on the political front. It remains to be seen how these events will actually play out, but historical post-election performance has been positive.

Key Dates
- The “safe harbour” date for states to determine and certify election results is December 8, while the Electoral College convenes to cast their votes on December 14.
- The deadline for the President of the Senate (Vice-President Mike Pence) to receive the formal electoral vote certifications is December 23.
- The House and Senate convene for a joint session on January 6 to count electoral votes.
- The inauguration takes place on January 20.
Conclusions
- The resurgence in COVID-19 cases has been troubling for investors. These kinds of events often prompt an emotional response and may lead to adverse behaviour, such as attempting to time the market.
- Although the full economic and financial market implications of the 2020 U.S. Presidential election will only be revealed in time, the longer-term trends of growth for both are expected to remain intact.
- Having the benefit of a professional financial advisor can help investors focus on longer term goals and avoid the pitfalls associated emotional responses to ongoing events.
Appendix

1 For the purposes of this article, this era begins with the 1952 Presidential election. The twenty-second amendment to the U.S. Constitution limited the presidency to two terms and was ratified in 1951.
2 Generally, a market correction is viewed to have occurred when the index has posted a cumulative 10% decline from the recent high.

